Field Museum Collections Database Visualization

Data is sampled from the activity logs of the China Hall collection (2008-2014) in the Museum's EMu asset management system. The dataset includes 1,818 separate physical objects from the database's catalog module, with a total of 19,178 separate changes captured (discounting automated updates) in the logs. For this visualization, the objects with the highest cumulative counts were selected, representing just over 10% of material in the China Hall collection.

Read the technical report.

After using the slider above, refresh page to return to dynamic activity.


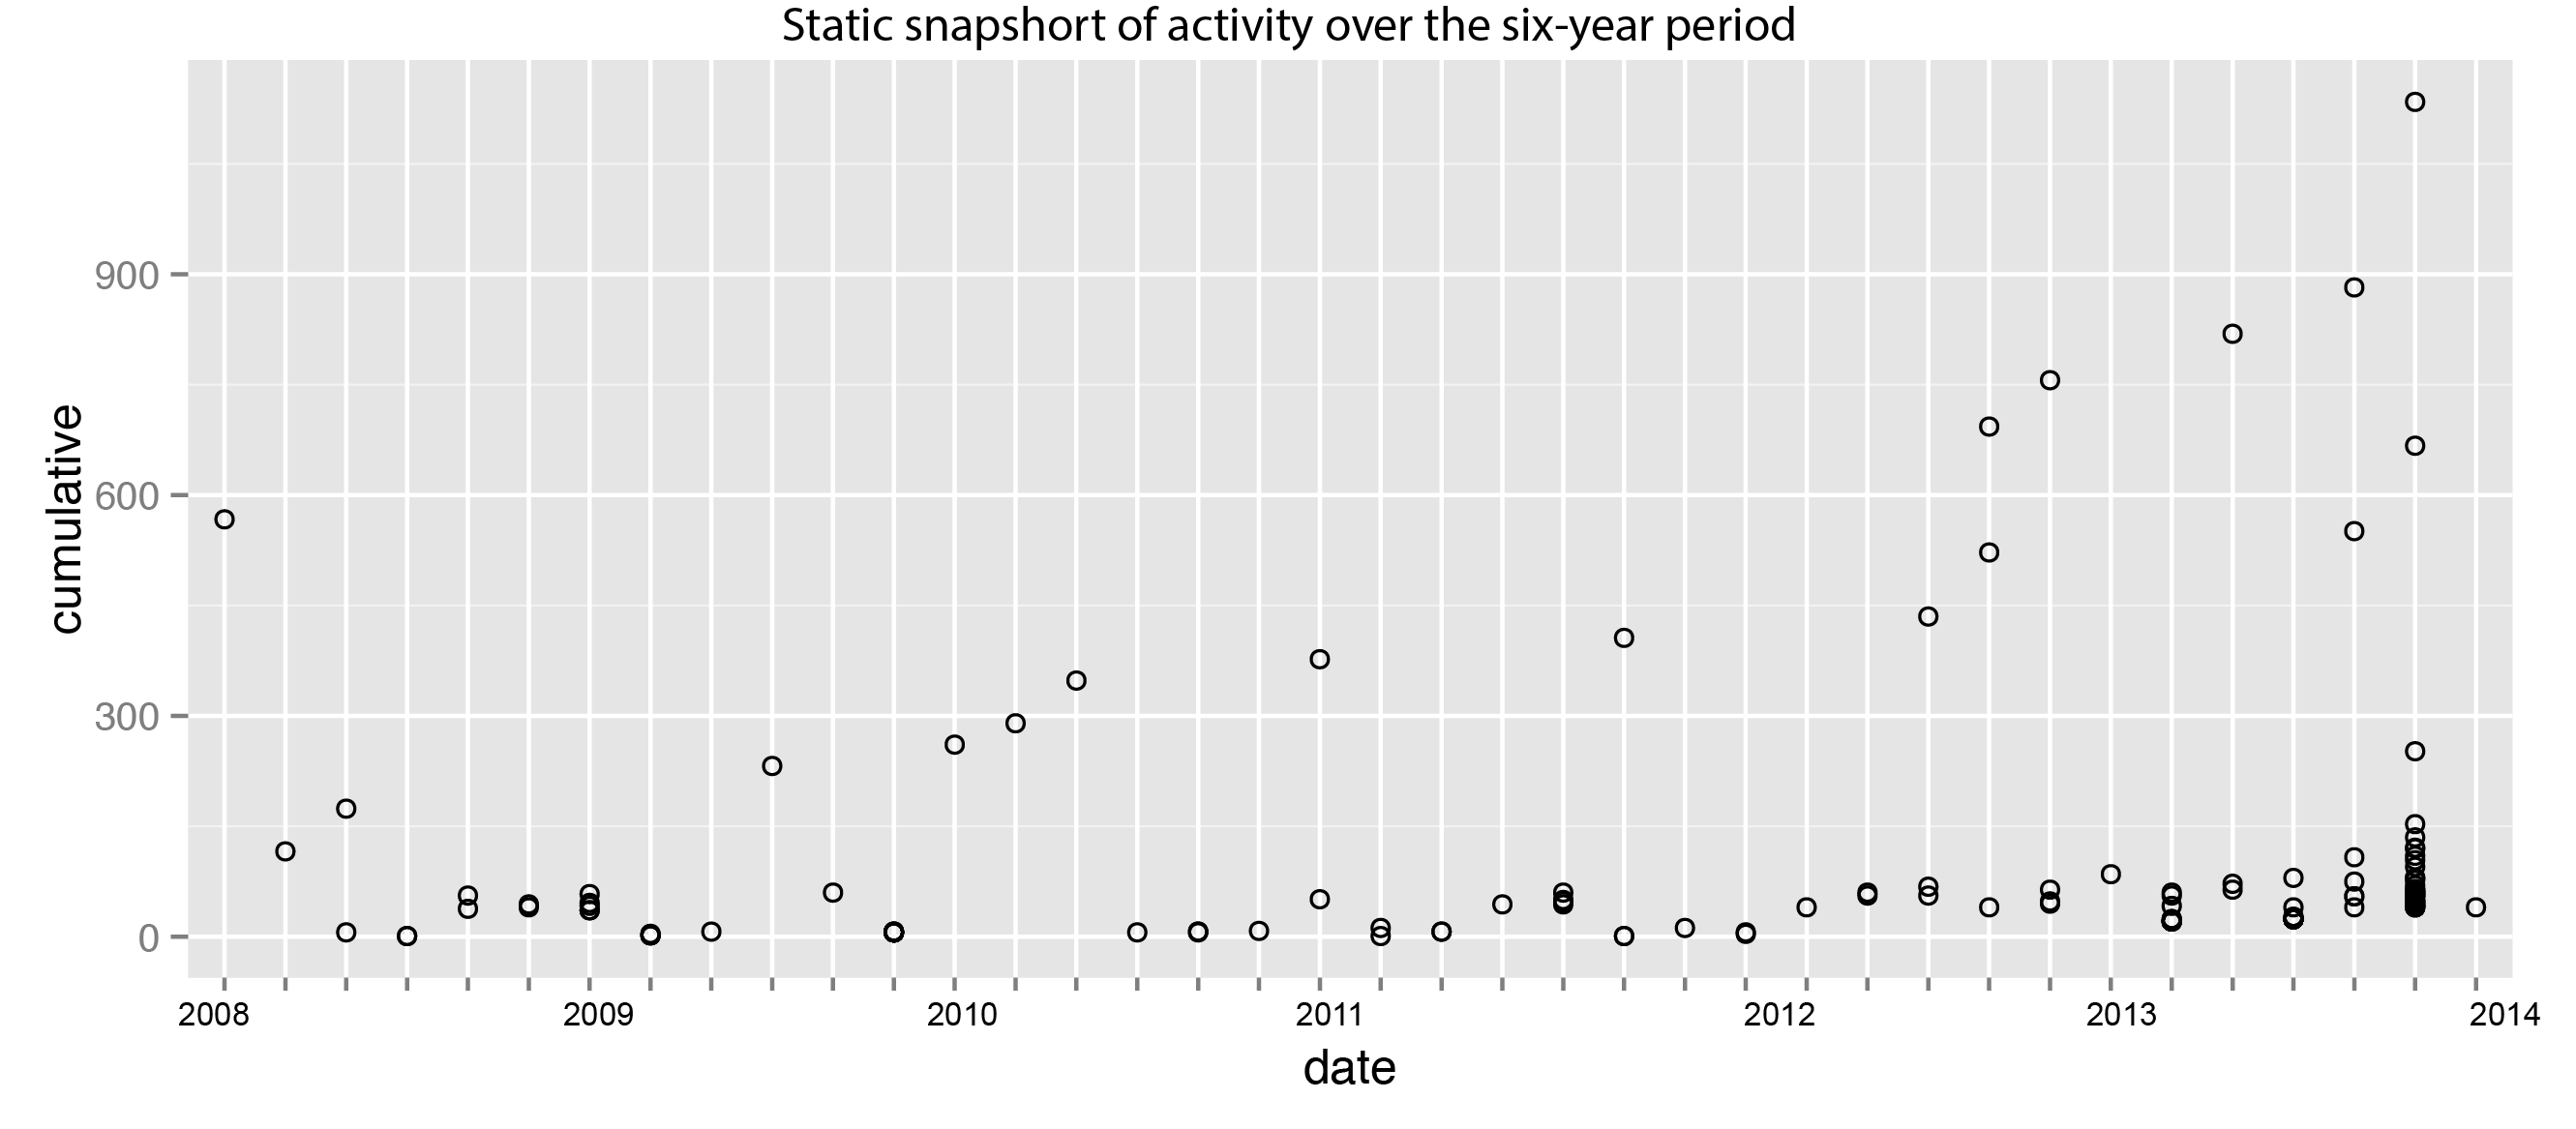
D3.js Dynamic Graph Visualization

  • Circles represent individual museum objects
  • Up and down (y-axis) movement tracks database activity on each object per month
  • Growth of circles (x-axis) captures cumulative changes to objects
  • Vertical bands show the proportion of objects in the Museum's four key collection areas
Rplot duration

Rights Statement

Designed and created by Kartik Adur, Richard Higgins, Jingsha Luo, Joshua Quick, Wensi Wang. Creative Commons Attribution-NonCommercial 4.0 International License.

The Field Museum asserts copyright on all data associated with this project. The data is available ONLY for not-for-profit scientific use with the stipulation that FMNH be clearly identified as the source of the data. FMNH requests copies or reprints of publications that are based on their collections.